
AMD: the investment of a life time!
 (03/03) The stock has just broke through the bottom of the trading bands (14.26) on the closing base. Now both the top and bottom bands are heading lower and that is an indication of starting a new down trend. Further weakness is expected unless it can close above the top of the trading band.
(02/28) The recent slide appears to have stopped as indicated by my own ADX type of indicator. However, is this end of the bear market for AMD? I do not have enough info to determine that yet. The rumor 2 days ago took it as high as 15.70, which coincidently is the top of my trading bands. The stock is still printing red candles at this moment. There are some encouraging developments though, the price has moved above the mid-channel line. More time and work are needed for AMD to start producing green
 candles. This stock could repeat the long sideway trading range action of Nov to Dec of 2006. Close above 15.70 preferably 16.10 will make some bullish waves and potentially start to produce green candles and a possible rally to ~ 20. Be patient and we just start to see positive signs but nothing indicating the bottom has already been formed.
(01/29) Closed under 16 and the patern is breaking down. Lower price is ahead. The broader market is also about to correct (see Nasdaq chart). Any bounce should be used to exit this stock. I will continue monitor this stock for potential bottom formation and if something is up I will update the chart.
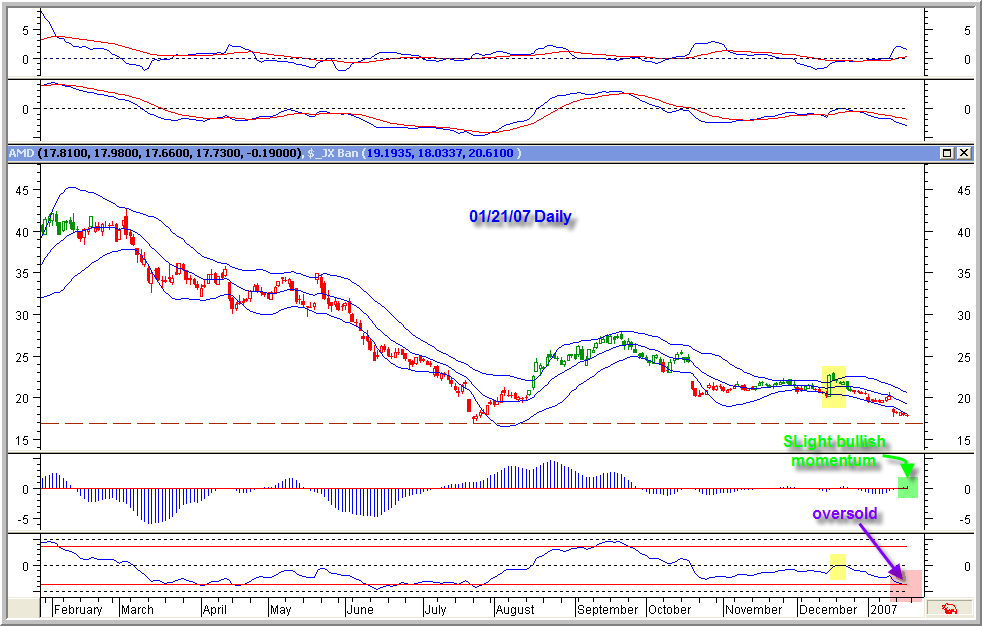 (01/21) AMD had a rough holoday season. Sorry that I was unable to update this blog during my vacation oversea. Now I am back and fresh. Let's examine AMD's technicals. Our trading bands got extrememly narrow during the Nov/Dec period which forecast an incoming price movement. We had a 1-day breakout to the upside however the stock could not hold the gain. The candles returned to red quickly. A classic false breakout followed by a bearish trend. The stock is currently retesting the 17 low and and in a down trend. Notice the Value OSc had never crossed abover the 50 signal line during the false breakout. Currently this indicator is approaching the oversold territory and once it emerges out of this zone, a buy signal is possible. There is one slight positive is the candle strength indicator is >0 while the stock is declining.
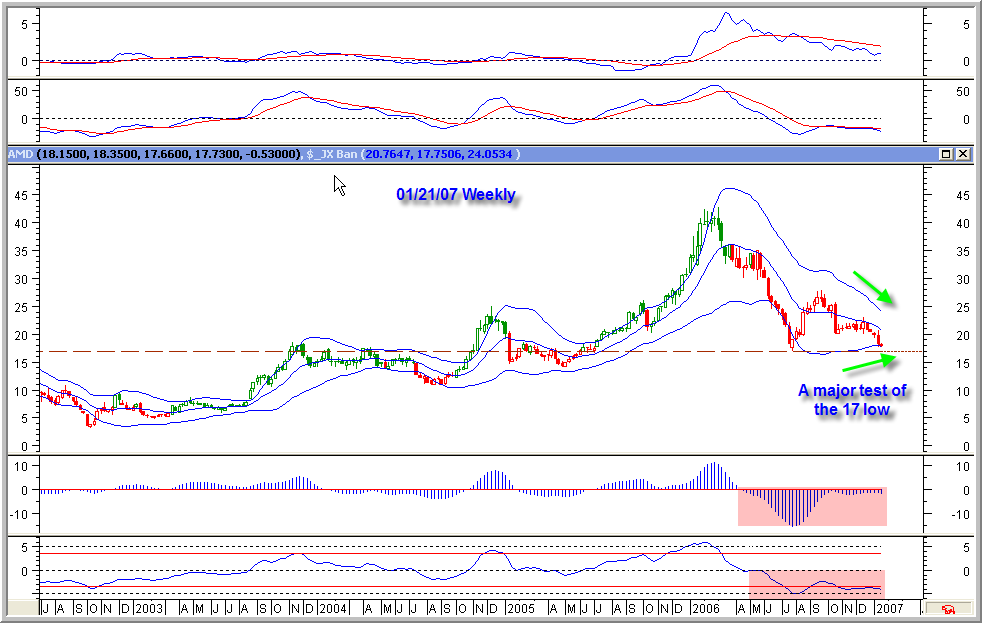 This is an early warning momentum indicator and it signals a build up in bullish momentum.
I would like you to focus on the weekly chart now. As you can see the weekly bands are narrowing fast and the are in the process of forming a bottom pattern. If the 17 support (lower band) can hold next week after the Tuesday report, we are likely having an intermediate term bottom here.
(11/26) The lack of update on AMD recently was mainly due to there are not much to say about this stock. However things are starting to falling into places lately and the stock is in a crucial junction as shown in the daily chart. AMD has been trading in a tight range however it has
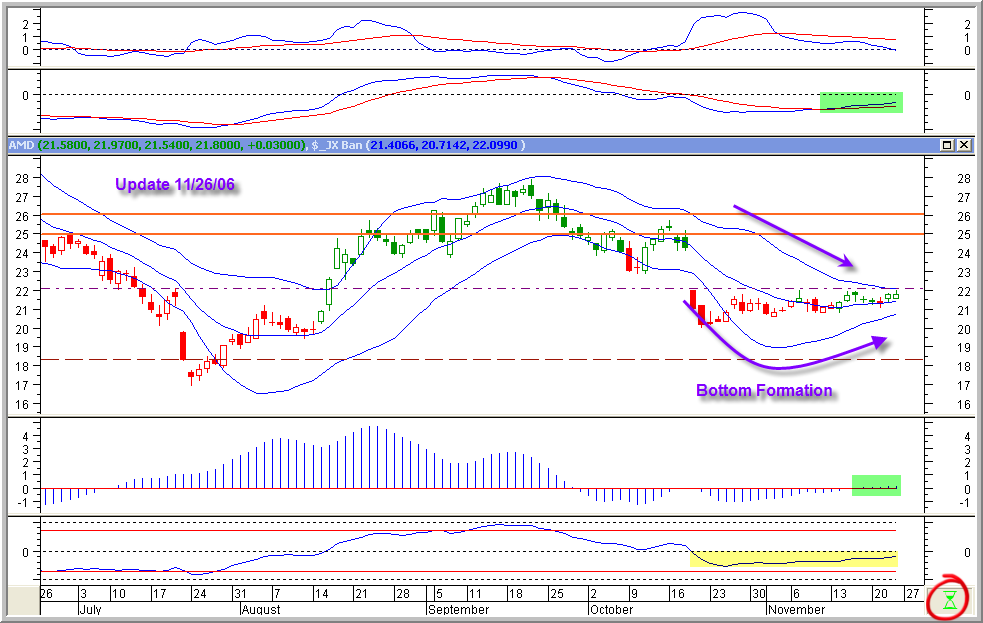 slowly built up some monentum (the candle strength indicator x above zero). In addition, my traidng channel formed a bottom pattern late Oct and early Nov. Lately candles are also colored in green even the stock price hasn't done much. All these together indicate a possible bullish movement is right around the cornor. Breaking and closing above the upper trading channel (22.10)will signal the start of the move and breaking below the bottom channel (20.71) will indicate lower price ahead and probably a retest the 17 low. I think that the first scenario is the likely outcome of this buildup. Let's what the market will say. The market is always right!
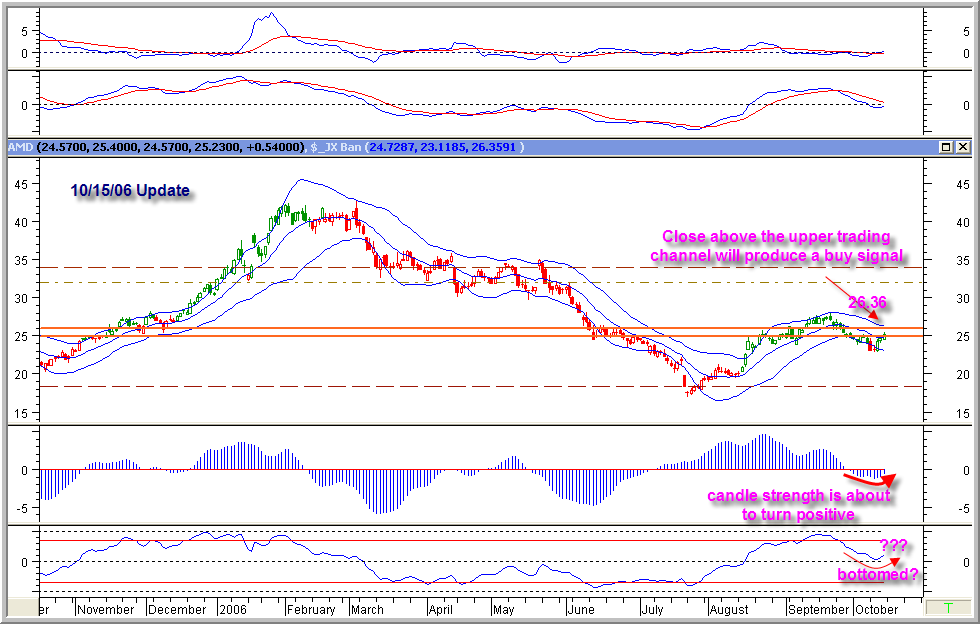 (10/15) Almost a buy signal. Friday's close is above the mid-trading channel line and candle strengh is turning and ready to cross the zero line. If a buy signal is indeed generated in the next few days the weekly chart points to a potential target of 31-32.
(10/04) The recent weakness has taken this stock all the way to the support near 23.70 which is also the 38% Fibonacci retracement line. As expected the stock rallied off the support and formed a bullish engulfing candle today. This is very encouraging since a break below 23.7 is likely to signal a further weakness. There are still signs of weakness as indicated by the candle strength indicator and the down sloped trading bands. Watch how the stock behaves near the 25.76-26 zone a strong close above that with the support of candle strength indicator (x-over the 0 line) will likely signal the stock is gaining momentum to the upside. Since the candle are still green, I remain my bullish bias for AMD.
(09/10) Updated both daily and weekly charts. The trading bands for the weekly chart are very wide. In general the most powerful trend starts with narrow trading bands. The stock is up against a long term resistance level and the candle strength indicator is weakening. Unless the stock can close above the top of the trading band (26.85). The stock is likely to lock in a trading range to digest the recent gain or worse to attempt to retest the recent low. IMHO, the better buying opportunatey will be ahead of us on the next retracement. Remember the weekly candle is still red although the daily chart looks good. When both daily and weekly are in sync, the stock will be primed to move siginificant higher.
(08/31) After a long dull "summer" hibernation, the market starts to show sign of life again. Let's see what we have with AMD first. The drop has finally stopped and the market has actually produced a buy signal 2 weeks ago. The price bullish momentum has been building up during the last phase of the sharp decline. The stock is currently just beneath an important resistance level (~25). A consolidation here or a retracement is healthy for the stock at this moment IMHO. The weekly chart also shows the 17 is a significant bottom and a long term up channel support. No need to be too aggressive here. Accumulate slowly and there are plenty of time left to buy IMHO. Buy on the retracement or the retest of the low.
(07/01) Patient! The trading bands are
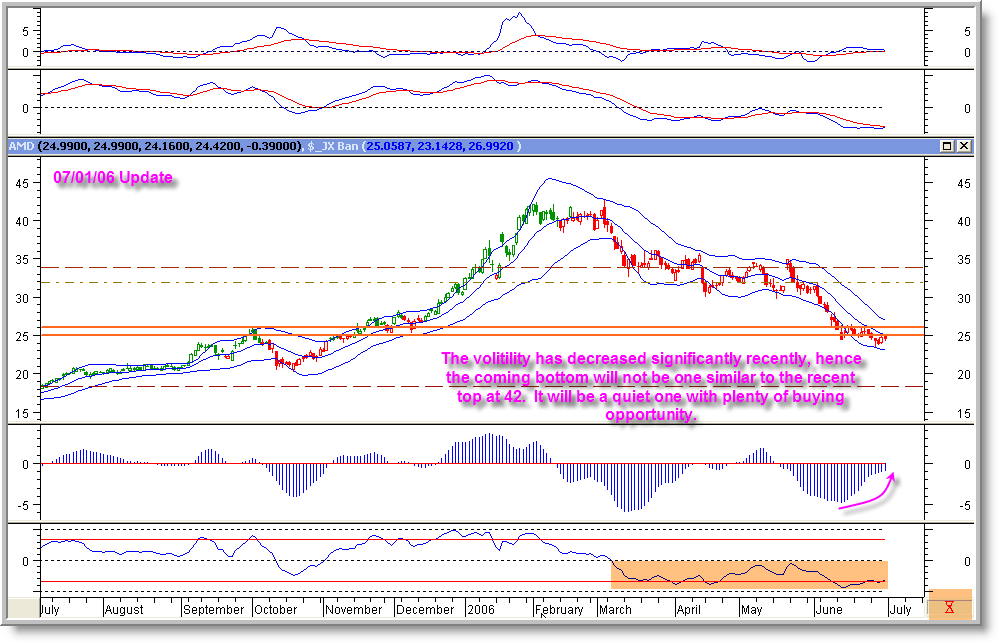 narrowing and the down momentum has also slowed quite a bit. The bottom will be a quiet one (low volume and low volitility) which will offer us plenty of buying opportunity. Therefore no need to rush back in for "THE" good price. The candle strenght indicator is approaching the zero line again. Decision point is coming soon and I will update charts more frequently to keep you informed. By the way chart out my Nasdaq chart update. The previous low (2050) for the index has been confirmed to be THE bottom.
(06/19) AMD is very oversold and it currently sitting on the lower trading band of the weekly chart(which serves as a strong support). My chart indicates that AMD is very close to a local low(if now THE LOW). A major turn around is right around the corner (within 1-2 week). Perhpas this IS the LOW that we have been waiting for sometimes now. Candle strength has bottomed and is improving fast. If the momentum continues to build up and eventually breaks through the zero line, the bottom is likely in. Continue to exercise caution and be patient! It is almost there!
(06/12) A buy signal is no where to be found. The stock continues to drop. The support at 25-26 is a major one and should provide at least a decent short term support. Notice that the candle strength indicator is forming a round bottom? The lower weekly trading band is also near this price range. I actually think the bottom is very near. If you want to live dangerously and are not afraid of a falling knife, this will be the place to pull the trigger. Or you can always wait for the buy signal. ;-) (blogspot's server is experiencing some problem for uploading my chart. I will try to post the chart tomorrow.)
(06/08) As expected, the 30 did not hold. The likelyhood we are seeing the last leg of the decline is very high. Be ready when we have the signal to buy because my signals have been proven right on the money since the $42 high.
(06/03) Candle strength indicator is appreantly in the pocess of making a bottom here. Considerating the value oscillator is also rising although very slowly recently. All these indicate that momentum is shifting (slowly). We need to see the Value Osc to cross the zero for a confirmed buy signal. Paitent! Since so many people are counting on the 30 support, I won't be surprised to see it being violated very briefly to take out stops and to trap some bears. Just look at how the the well established ~14 support was penetrated in 2004 before the bull run to 25.
 (05/29) It's been long since I posted the weekly chart. It is kinda intersting to read some of my comments made in the past. Actually most of them were quite accurate. ;-) I have stared and studied the weekly chart this long weekend for hours (seriously no kidding) all the way back to early 90s. The conclusion I came up with is that the current trading range will likely extend for a while. You see the trading bands are just too wide. The stock had a tremendous run and the volitility needs to settle down. The market needs to DIGEST the advance made in the stock price and to ACCEPT AMD's new role as the leader in chip technology. It is likely a boring summer for this stock and I am looking for the Q4 for some excitment. Wake up if AMD can manage a few weekly close above 35!
By the way the highly hyped Dell event turned out to be a one-day wonder and the stock could not hold its gain (see my previous update) hinting that the stock is not ready for yet another run. News rarely matters. It is the market intrinsics (technicals and psychology) that will determine the stock price. That is why I don't give a damn about news. It is seriously over-rated and it is only useful for the market novices in their search for reasons of market movement. The damn market is irrational and it will do whatever it wants. It has no mercy! Learn to live with it and we will be long-lived in the market place.
Back to Home
(05/24) All the gains were gone in 3 trading session. So the trading range remains and we need to continue practicing our patience. The candle strength did not turn back up as I expected rather it continued falling. The 30 support is pretty good but AMD is know to break a key support before the final bottom (a head fake to scare away weakhands). Just look the chart you will see plenty of this example. So I will not be surprised if the 30 support is taken out before the bottom is finally in.
(05/21) A close above the top of the trading band has signaled that the down trend is in serious trouble. Although the candle is still red, the trend has ended. A new bullish trend can start if AMD can copnsolidate here and hold some of its gain yesterday. There is also a price/indicator divergence at the "W" bottom. It is highly possible that the decline is over and the bottom is in. Good Luck, buy on the pullback (the gap filling attemp) if you are a LT player.
(05/18) LOL, Dell has surrendered! I have been saying this for a long time now. AMD does not need Dell. It is Dell who need AMD for his survival. Well, let's see how the market reacts to this positive development. Watch the upper trading band. A close above that will end the recent correction with a double bottom pattern.
(05/15) Be patient and watch the lower end of this range. re-read my 5/7 comments again. We are getting very close to an entry point again. However if somehow the 30 support is penetrated the true support is double line near 25-26. Let there be no guess work and let the chart tell us when to buy.
(05/08) Perhpas this warning from Dell will be trigger the last down leg I was talking about yesterday before the runup resumes. It is time to start to think about buying AGAIN!
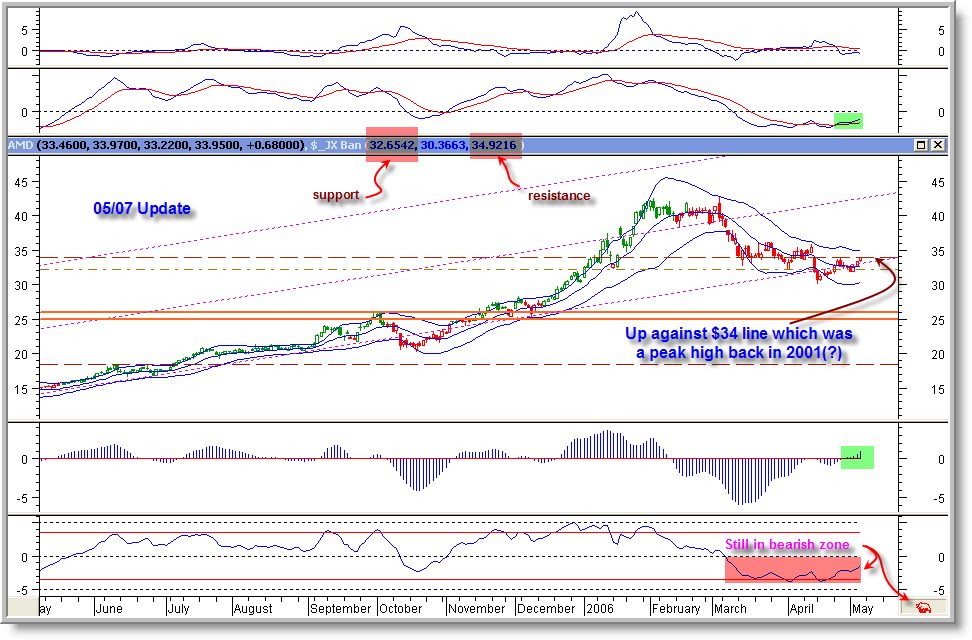 (05/07) If AMD can form a base here between 32.5 to 35 in the next couple of weeks, my trendfollowing system will improve significantly and will be at a position to issue a trend reversal buy signal QUIETLY. There should be another attemp by the bears to push the price down towards the lower trading band but it will likely meet with bargin hunters. This will be a low risk buying opportunity if you want to establish a long term position.
(05/04) AMD's technicals are improving. The down trend is not officially over but it is very extended and a close above the top of the trading band (~35) should in theory end this correction. It certainly gets very interesting lately.
(04/17) A major chart breakdown! Further weakness ahead.
(04/13) Chart update. So close yet so far. Another setback for the bull. AMD seems to have form a down-sloped tradin range if 31.6 can hold.
(04/12) Chart update. A few more strong days we shall start to get green candles. Getting close....
(03/15) AMD appears to have found a short term bottom yesterday on heavy trading by forming a piercing line, a bullish reversal candle. This 32-34 zone provides a nice support zone and is likely to be revisited and confirmed soon. The next line of support will be near 28 (a fibonacci support and a previous high, see my charts @ stockcharts.com for details). The damage to the technicals resulted from this decline is severe and needs time to "heal". I am expecting a trading range market to work on the technicals before a new long term "buy" signal can be produced.
(03/14) Chart update. You can't get a better call than this. My chart (indicator) ROX!
(03/08) It played out exactly the way charts have been warning us the last 3+ weeks.
(03/07)The current AMD chart resembles that of Jan 2005 including these indicators!!! I hope I am wrong. However, as an investor I should "FEAR"at this moment rather than "HOPE". Prepare for the worst. (03/04) A bearish engulfing candle with 2x avg daily volume is something you can't ignore if you know anything about TA. Have you noticed the hi of yesterday was 42.70 while my upper trading band is @ 42.79? Bulls couldn't get through this price and the stock actually closed down ~$2 after making a new 52 week high (intraday). Keep your eyes on the lower trading band near 37.74, a close below that will definitely be very bearish.
(03/02) Despite a nice rally yesterday, the technicals continue to deteriorate. The candle strength indicator is in the negative territory and start to decline again after a brief pause. We got a classic top formation based on my trading bands. The color of the candle is RED meaning the trend is down and 12 of the last 13 candles are RED! Watch the mid-band closely and close below it (40.26) would suggest further weakness ahead. The lower band (~37.5) could provide some short term support for this stock. Thank you for listening!
 (02/27) It is time to pay a visit to our old friend, the weekly chart! Although cadles are still green, there are many signs of weakness. First the candle strength indicator is topping. Second the value based oscillator is at extremely overbought level and appears to start correcting. Last, this is the first time since last Oct that we have a candle that is below and isolated from the top trading band (not even tagging). When the top trading band move much higher and way past the high of the candle in an uptrend, it generally signals a top or a pause. On the daily chart, we have ONLY 1 green candle among the last 10 candles, the rest are RED!
 (02/23) 1. contracting trading bands indicating formation of a top/ abottom! 2. Decreasing bullish momentum (measured by candle strength <0)!>
(02/20) Bad news! The candle has dipped below the middle trading band and candle turned red AGAIN => weakness ahead!
(02/16) Finally the candle turned GREEN! Not completely out of woods yet but still an encouraging development. Needs to stay in green and breaks 42.50. If it flips flop again and closes below 40.42. I will be very concerned. The narrowing trading bands still are calling for a top or a pullback. So at least expecting a trading range market near term unless it can clear 42.50 in a hurry.
(02/14) Well, the late afternoon rally managed to produce a bullish candle and the ctock closed 0.10 higher than the mid-band. It is an improvement. But is it enough? If AMD can manage a few more strong up days, the color of the candle will revert back to green. If it can't break the 42.5 and start to weaken again, the two parale lines will project a potential pullbake zone which is around 33-36. Fibanacci retracement has a potential target of 34. It is definitely an interesting time and I am pulling my hairs try to disecting my charts. ;-)
(02/13) Bad news! The candle strengh indicator closed under the zero line AGAIN. The color of the candle also turned into red and the stock crossed below the mid trading band. In addition both top and bottom trading bands are narrowing (moving in opposite direction) suggesting a top has been completed. Protective actions (buy puts or sell covered calls or short shares) will be necessary to pretect any opening long positions if this situation is not rectified in the next few days.
(01/25) Although the candle strength indicator continues its decending, I won't worry about it too much since it is way above 0. Trading between the top two trading bands is bullish.
(01/18) An awesome Q4 report tonight! AMD has shocked the world and demonstrated that Intel is nothin' but a paper tiger! Expect some short term volitility and wild price swings. We have positioned very well to take the full advantage of this newly "discovered" domination of AMD and I intend to ride this monsterous trend as long as I can! Buy on the weekness!
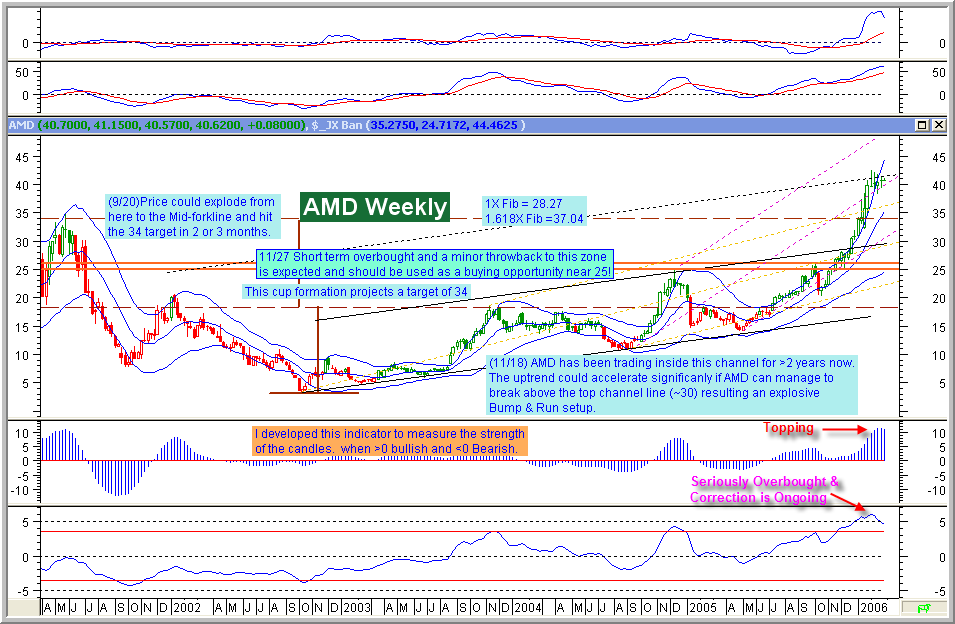
(01/13) This gravestone doji which is a bearish candle pattern and the apparent overbought condition call for caution. However, there are no indicator calling for a sell yet. The Fibnacci target of 37.04 was reached yesterday (other relavant targets projections were 0.9xSMH and 1.4-1.5xINTC which were also reached yesterday). The stock is currently sitting at one of my long term targets-34. A counter trend correction or a sideway consolidation is needed and it will help to recharge bulls for the next leg up. The upper chanel line could serve as a support for the stock and buying at the support carries minimal risk!
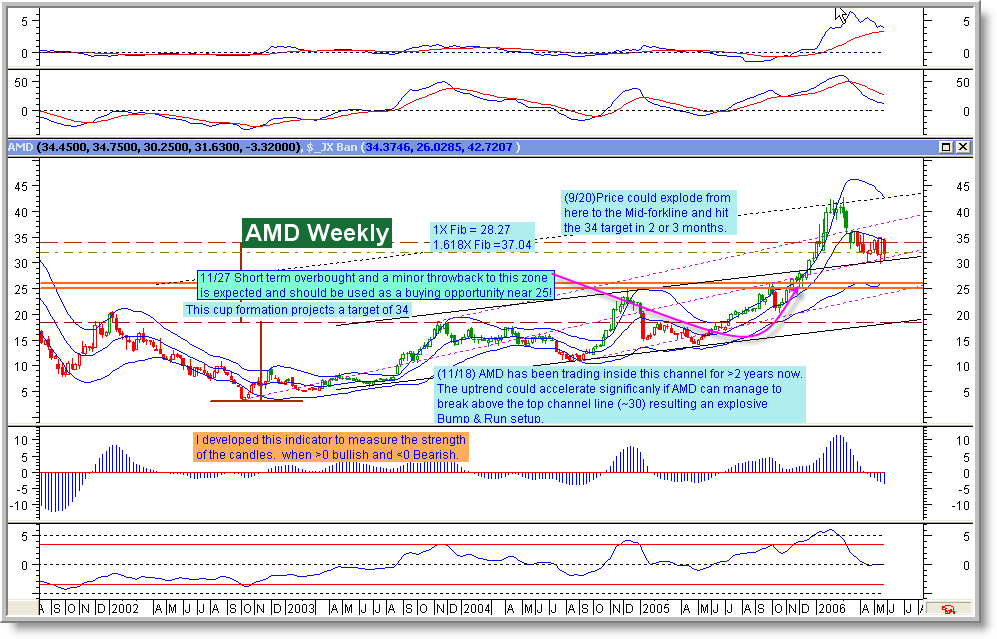
(01/08) It is time to review our AMD's weekly chart AGAIN! Please read my comments(9/20 and 11/18) on this annotated chart AGAIN! This stock has acted exactly as I had predicted a few months ago and now it is sitting on the 34 target. To be honest with you I am a little scared by the strength this stock has demonstrated lately. I have looked very hard and tried to find a reason to take profit now but I can't find any. The only thing comes close to a "S" word is that the last indicator at the bottom of the chart is in an overbought territory. Nothing on the daily chart suggests a sell either. I am going to listen to my indicators and continue to ride it.
(12/20) Read my 12/14 comments again! We got the predicted breakout and the candle strength turned positive AS WELL signalling higher prices (~33-34) ahead(see the weekly chart below).
(12/14) Updated the daily chart and the weekly chart(below). Finally a green candle! I was starting to get worried. A few more green candles will alleviate my concern! Watch 28.25 for a upside break towards the 33-34 zone.
(11/28) Updated the daily chart. A minor short term correction may be near!
 (11/21) Very bullish weekly close! A bullish trend is strong whenever the bar is green and closed above the upper JX band. In addition the weekly candle strenth finally turned up. The correction is definitely over. A close above 30 will usher in an explosive bull move towards the 33-34 target (short term) and the 53 target (long term).
  (11/14) The recent correction has not changed the long term outlook of this stock based on this chart ( 3-day/bar). It appears the correction (consolidation) is over and the stock has resume its bullish trend. Both JX-bands are starting to move up again. Very encouraging developemnt!
(11/3) Printed a green bar today. Perhaps the correction is over.
(10/30) Second-class Intel to trail AMD for years
(10/28) Intel Self-Destruct Mode Aids AMD Momentum
(10/24) A new daily chart. Up against the mid channel resistance line NOW!
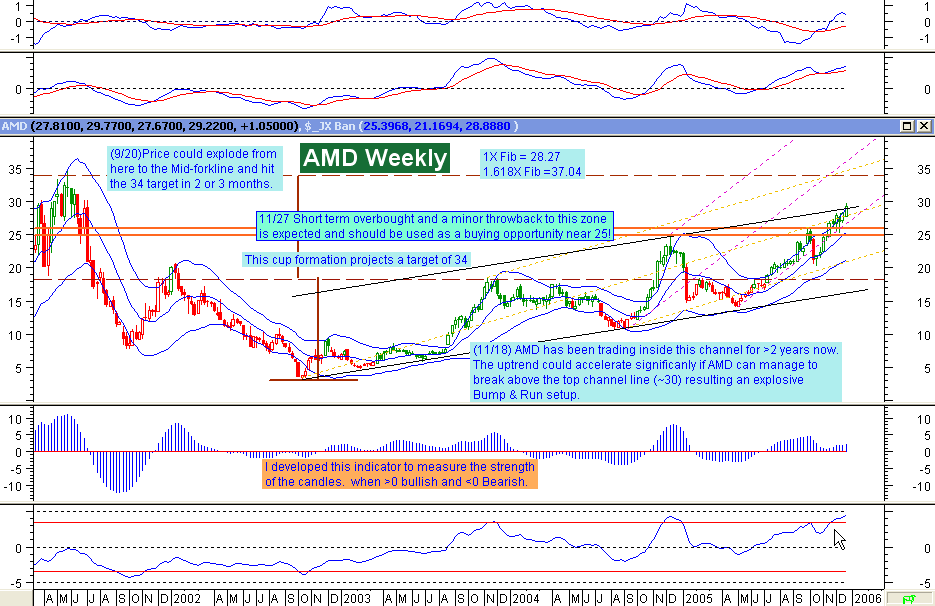
(10/2) Here is a weekly chart for you AMD lovers out there. Enjoy the ride! (9/28) AMD= "New breed"
 (9/25) Barron's article (a must read) On AMD's Menu: Eating Intel's Lunch. Someone also see 50s. By the way, I have been calling for 53 for over a year now. Of course my targets are all based on charts. I don't care about fundamentals.
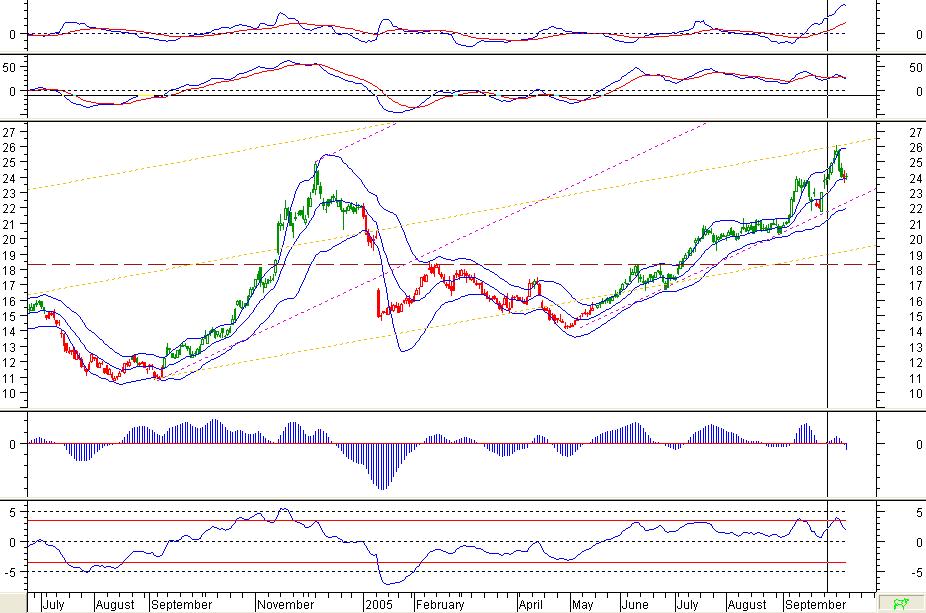
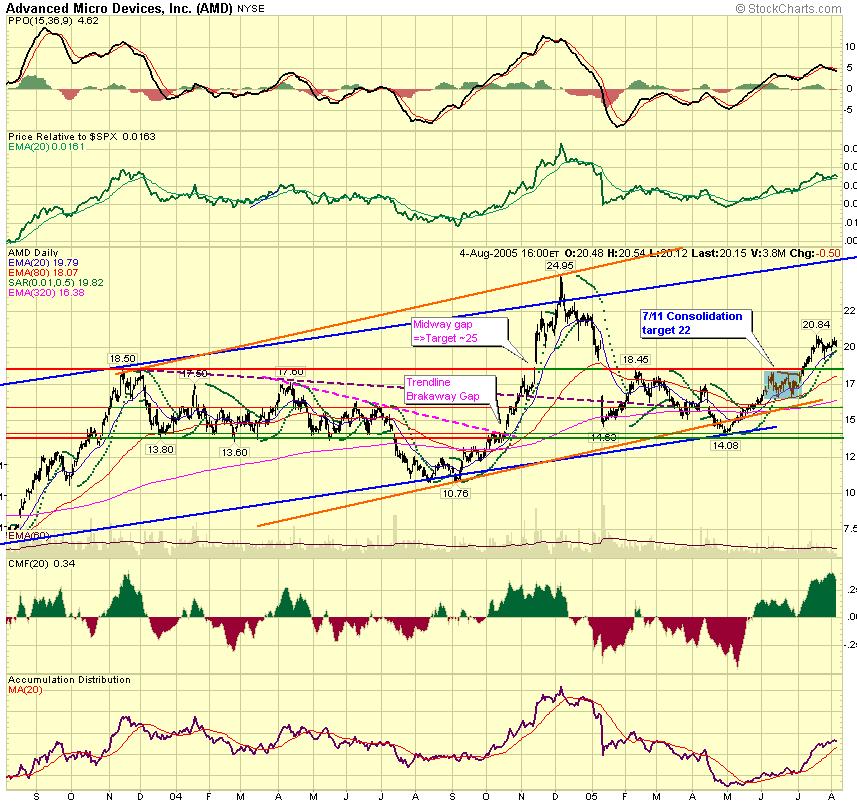
(9/20) Andrew's pitchfork line serves as a good trendline for the current uptrend. The reaction to 21.8 was expected and is healthy for the continuation of the uptrend. The support @21 is strong and any pullback to this support should be used as a good opportunate to add or pyramid.
(9/7) Yesterday's breakout has been confirmed today. Look at the blue bands, close aboved the topper band is very bullish.
(8/31) Added more 25 Jan 07 leap yesterday. I am done buying (15% margined). The market appears to want to go up even with $70 oil. I am expecting a great bull run for the remaining of the 2007.
(8/19) Added a few contracts of 25 Jan 07 leap to my AMD call collections today.
(7/12) Added AMD daily chart. BTW I am long AMD since sumer 2003.
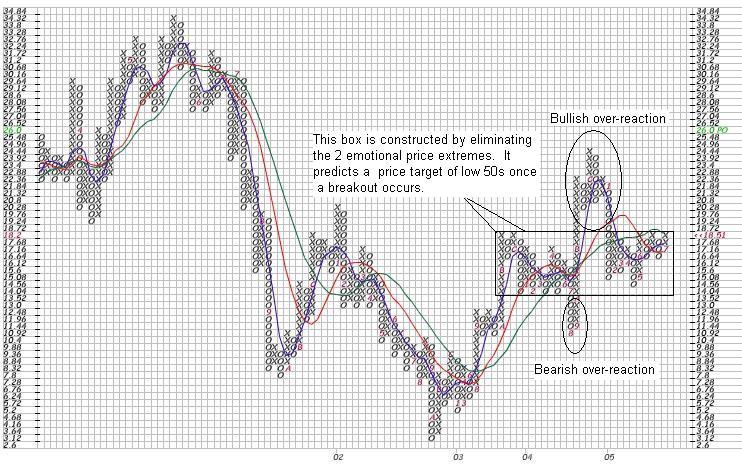
(7/6) On July 2004 AMD broke through the long term support of 14 which resulted a ~$3 drop to the 10.8 support within a month. Many weak longs bailed out and many bears jumped in hoping for a single digit stock price. However, the stock soon bottomed and made a dramatic advance in the following months (the two long columns of O and X) and many bears were traped. The excessive bearishness created an amazing bull rush [too fast even for my standard ;-) ...an over-reaction to the other extreme ]. The excessive bullishness was subsequently corrected @ the beginning of this year and the stock has basically traded between 14 to 18 for ~2 years except the 4 months over-reacting period. The resistance @18.5 is significant and has been in play since 2003. Watch how the stock reacts at this price. If AMD tags 18.72, the resistance is consider broken and a significant advace is expected. Retest the previous high of 25 is likely and the next target will be around ~32-33, low 50s thereafter. I would be a buyer if the 18.5 resistance is cleared. Good luck!
posted by biobuck | 1:38 PM
|
7 Comments
![]()
![]()